


AWS Lambda is a powerful serverless computing service that allows you to run code without provisioning or managing servers. However, monitoring Lambda functions can be challenging, especially when debugging issues in production. That’s where Sentry comes in an application monitoring and error-tracking tool that helps developers detect and resolve issues quickly.
Why Monitor AWS Lambda Functions?
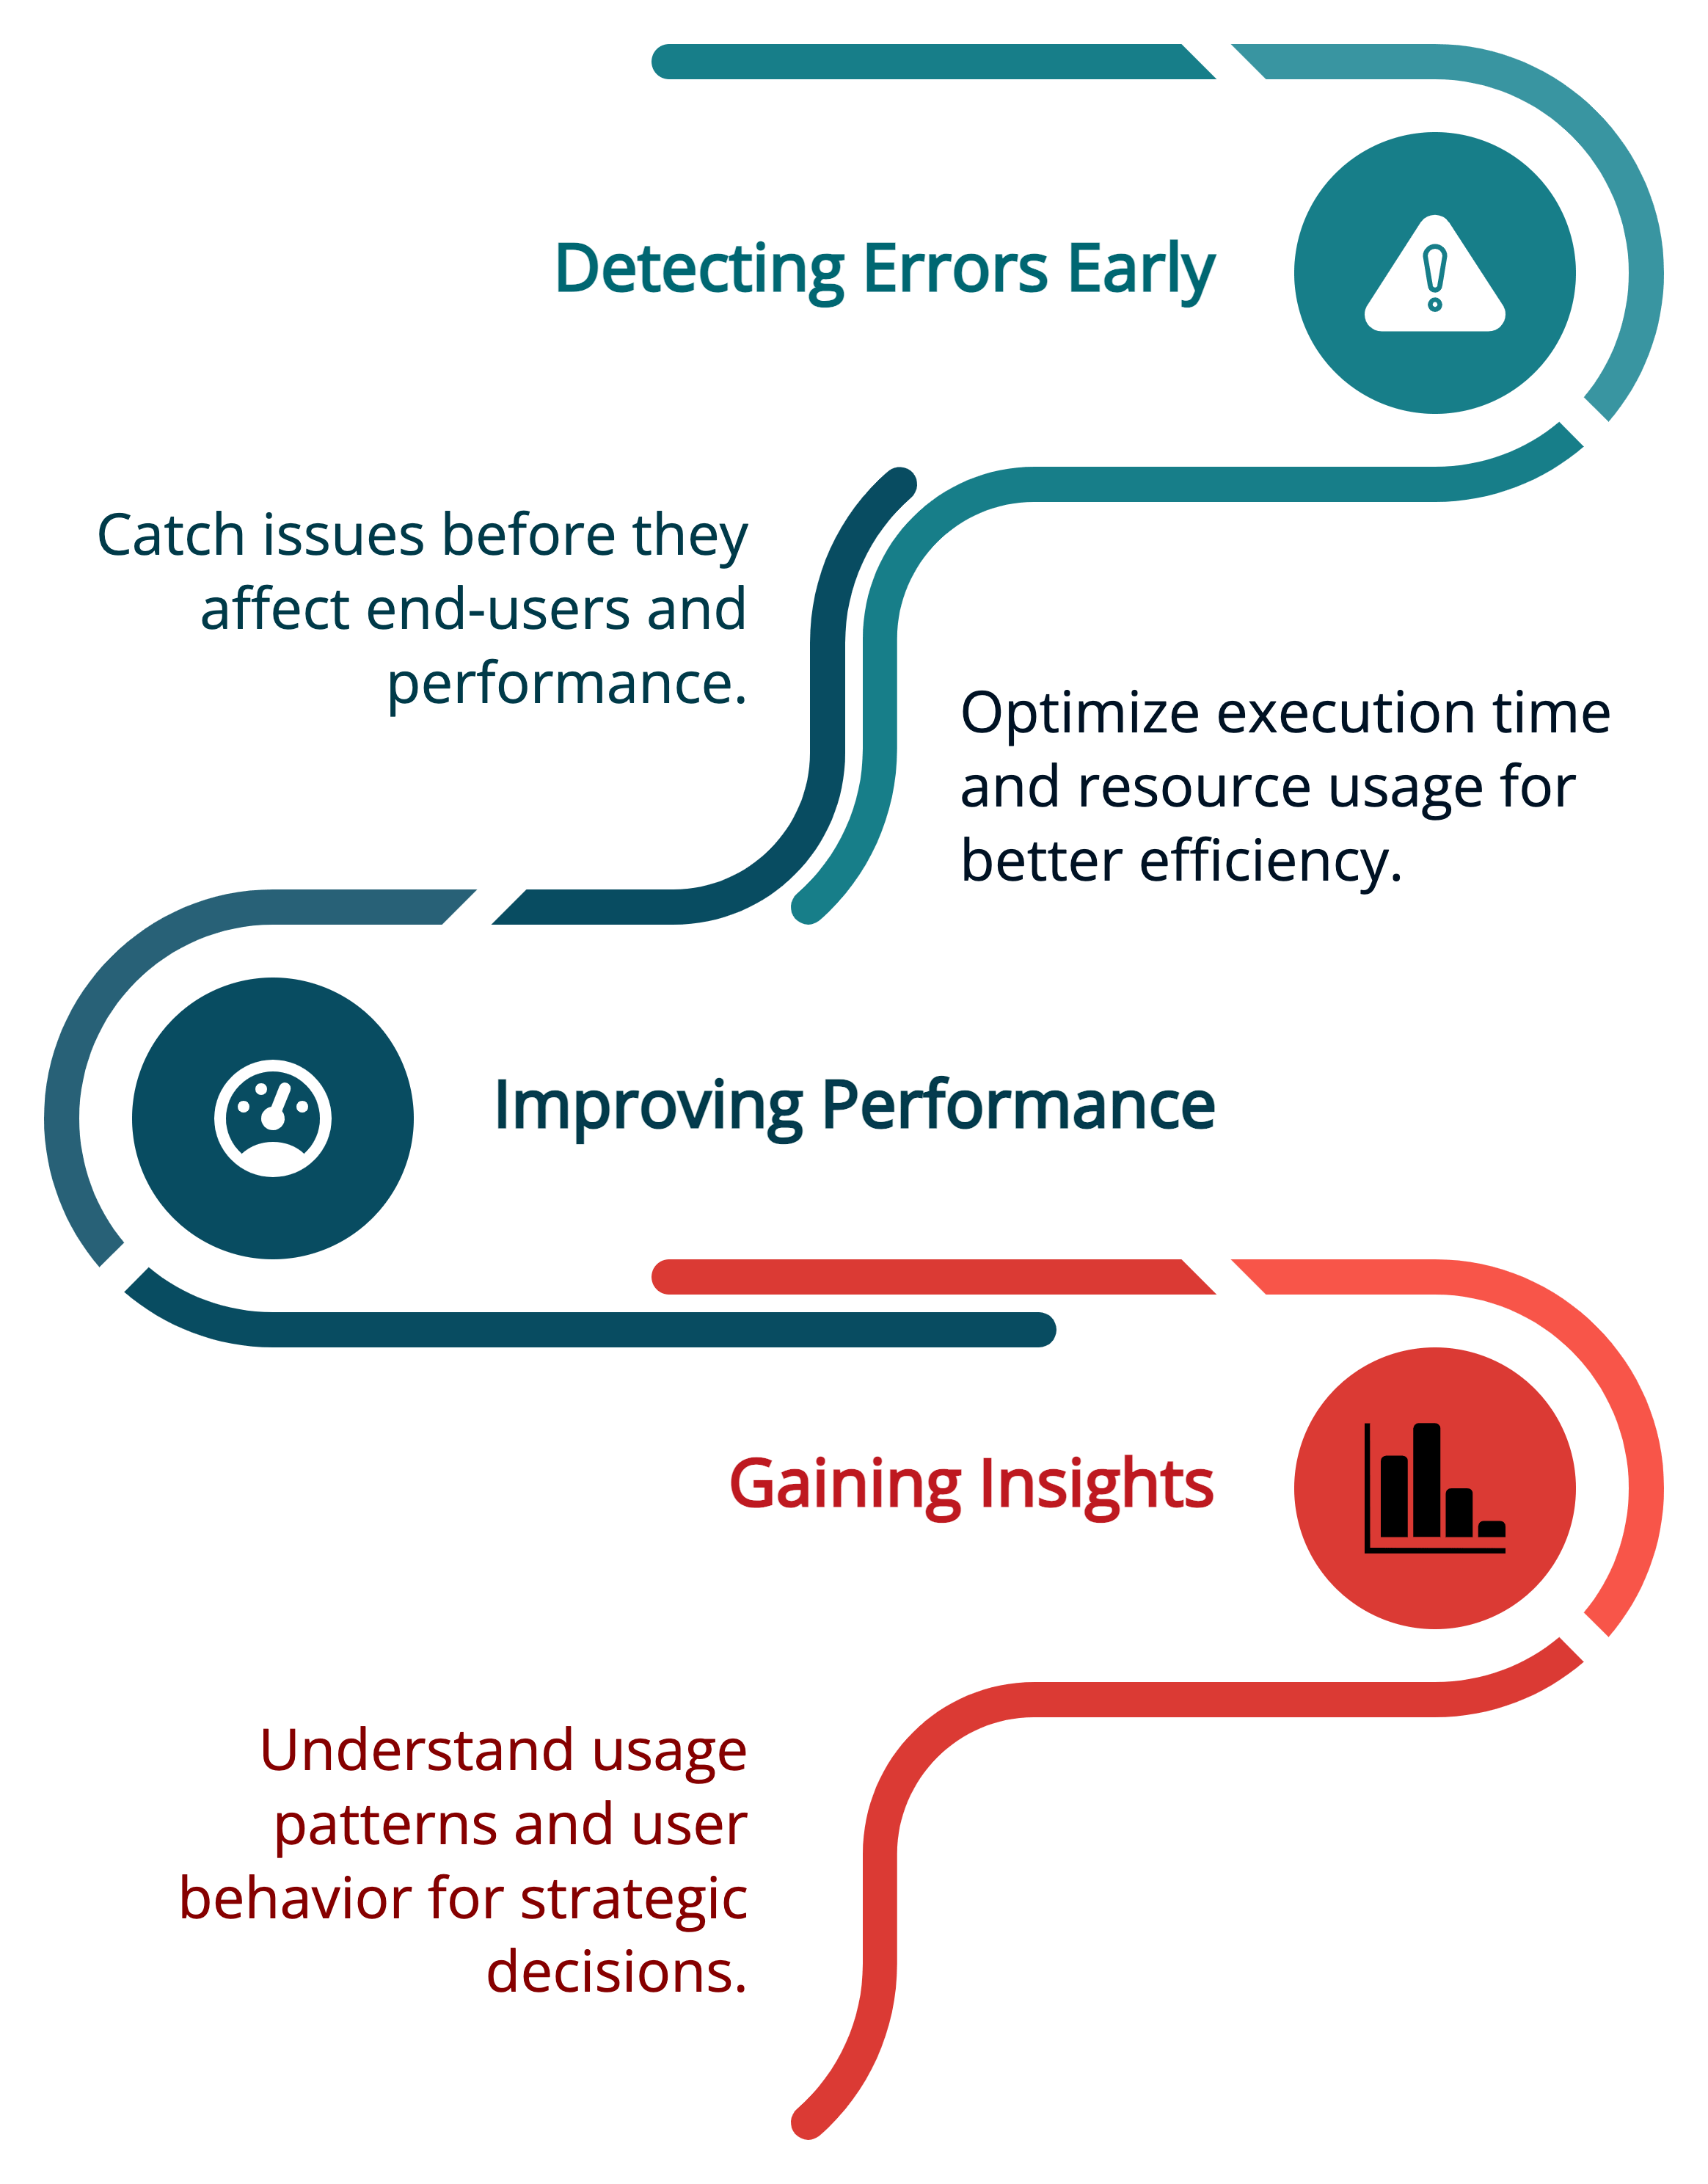
1. Detecting Errors Early
Lambda functions run in an ephemeral environment, meaning failures can be difficult to diagnose without proper logging. Monitoring ensures you catch errors early before they impact users.
2. Improving Performance
By tracking execution time, memory usage, and latency, you can optimize your Lambda functions to run more efficiently.
3. Gaining Insights
Monitoring tools like Sentry provide insights into error trends, deployment issues, and API failures, helping teams make data-driven improvements.
Setting Up Sentry for AWS Lambda
Step 1: Create a Sentry Account and Project
First, sign up for a free Sentry account if you don’t have one. Then, create a new project:
- Go to Projects > Create Project.
- Select Python as the platform.
- Copy your DSN (Data Source Name)—this will be used to configure your Lambda function.
Step 2: Install Sentry SDK in Your Lambda Function
AWS Lambda supports Python, so we need to install the Sentry SDK. If using a local development environment, run:
pip install --target . sentry-sdk boto3If using AWS Lambda Layers, you can package the dependencies separately and upload them as a layer.
Step 3: Initialize Sentry in Your Python Code
In your Lambda function, import and configure Sentry using the DSN:
import sentry_sdk
from sentry_sdk.integrations.aws_lambda import AwsLambdaIntegration

# Initialize Sentry with AWS Lambda integration
sentry_sdk.init(
dsn="https://your-dsn@sentry.io/your-project-id",
integrations=[AwsLambdaIntegration()],
traces_sample_rate=1.0 # Adjust this value depending on your expected traffic
)

def lambda_handler(event, context):
try:
# Your main logic goes here
return {
"message": "Lambda executed successfully"
}
except Exception as e:
# Capture and send the exception to Sentry
sentry_sdk.capture_exception(e)
raise
Step 4: Deploy the Lambda Function
If you’re working locally, zip your project folder and upload it to AWS Lambda via the AWS Management Console or using AWS CLI:
# Create a ZIP file of the current directory contents
zip -r lambda_function.zip .

# Update the AWS Lambda function with the new code
aws lambda update-function-code \
--function-name your_lambda_function \
--zip-file fileb://lambda_function.zip
Alternatively, use AWS SAM or Terraform for infrastructure as code deployment.
Step 5: Test the Integration
Invoke your Lambda function from the AWS Console or via CLI:
aws lambda invoke --function-name your_lambda_function response.json

Trigger an error intentionally to verify Sentry captures it:

def lambda_handler(event, context): raise ValueError("This is a test error")
Check the Sentry dashboard for logs and error details.
Advanced Monitoring with Sentry
Capturing Breadcrumbs for Better Debugging
Breadcrumbs provide a history of events leading to an error. Enable them using:
# Add a custom breadcrumb to help trace what happened before an error
sentry_sdk.add_breadcrumb(
category="custom",
message="This is a debug message",
level="info"
)
Custom Logging with Sentry
You can send additional logs to Sentry:
sentry_sdk.capture_message(“Something happened in Lambda!”, level=”warning”)
Monitoring Performance with Tracing
Enable performance monitoring to track execution time:
# Initialize Sentry with AWS Lambda integration and performance sampling
sentry_sdk.init(
dsn="https://your-dsn@sentry.io/your-project-id",
integrations=[AwsLambdaIntegration()],
traces_sample_rate=0.5 # Sample 50% of requests for performance monitoring
)
This helps identify slow Lambda executions and optimize performance.
Debugging Lambda Issues with Sentry
Sentry helps you track and fix issues in AWS Lambda functions by giving you real-time error reporting and performance data.
1. Identify Errors Quickly
Sentry automatically groups similar errors together. This helps you avoid getting overwhelmed by lots of separate alerts for the same problem.
Example:
If your Lambda function throws the same TypeError in multiple invocations, Sentry will show it as one grouped issue. This lets you focus on fixing the root cause instead of sorting through dozens of logs.
def lambda_handler(event, context):
value = event.get("value")
# This will cause a TypeError if value is None
return value.lower()
If several events are missing "value", Sentry will group all those errors under one issue.
2. Use Stack Traces for Detailed Debugging
Every error reported to Sentry includes a stack trace. This shows you the exact line where the error occurred, the function call sequence, and any variables involved.
Example Stack Trace Output in Sentry:
TypeError: 'NoneType' object has no attribute 'lower'
File "lambda_function.py", line 3, in lambda_handler
return value.lower()
You can also see the event data that triggered the error. This helps you reproduce the issue during testing.
3. Set Up Alerts for Critical Issues
You can configure alerts in Sentry to send messages when new errors happen or when issues spike in volume.
Example:
Send email alerts for all new errors
Send Slack alerts when a specific Lambda function fails more than 5 times in 5 minutes
How to set it up:
Go to Project Settings > Alerts, then choose your conditions and channels (email, Slack, or others).
Benefits of Using Sentry with AWS Lambda
When you integrate Sentry into your Lambda functions, you get better visibility into what your code is doing and when it fails. This helps you catch and fix issues faster.
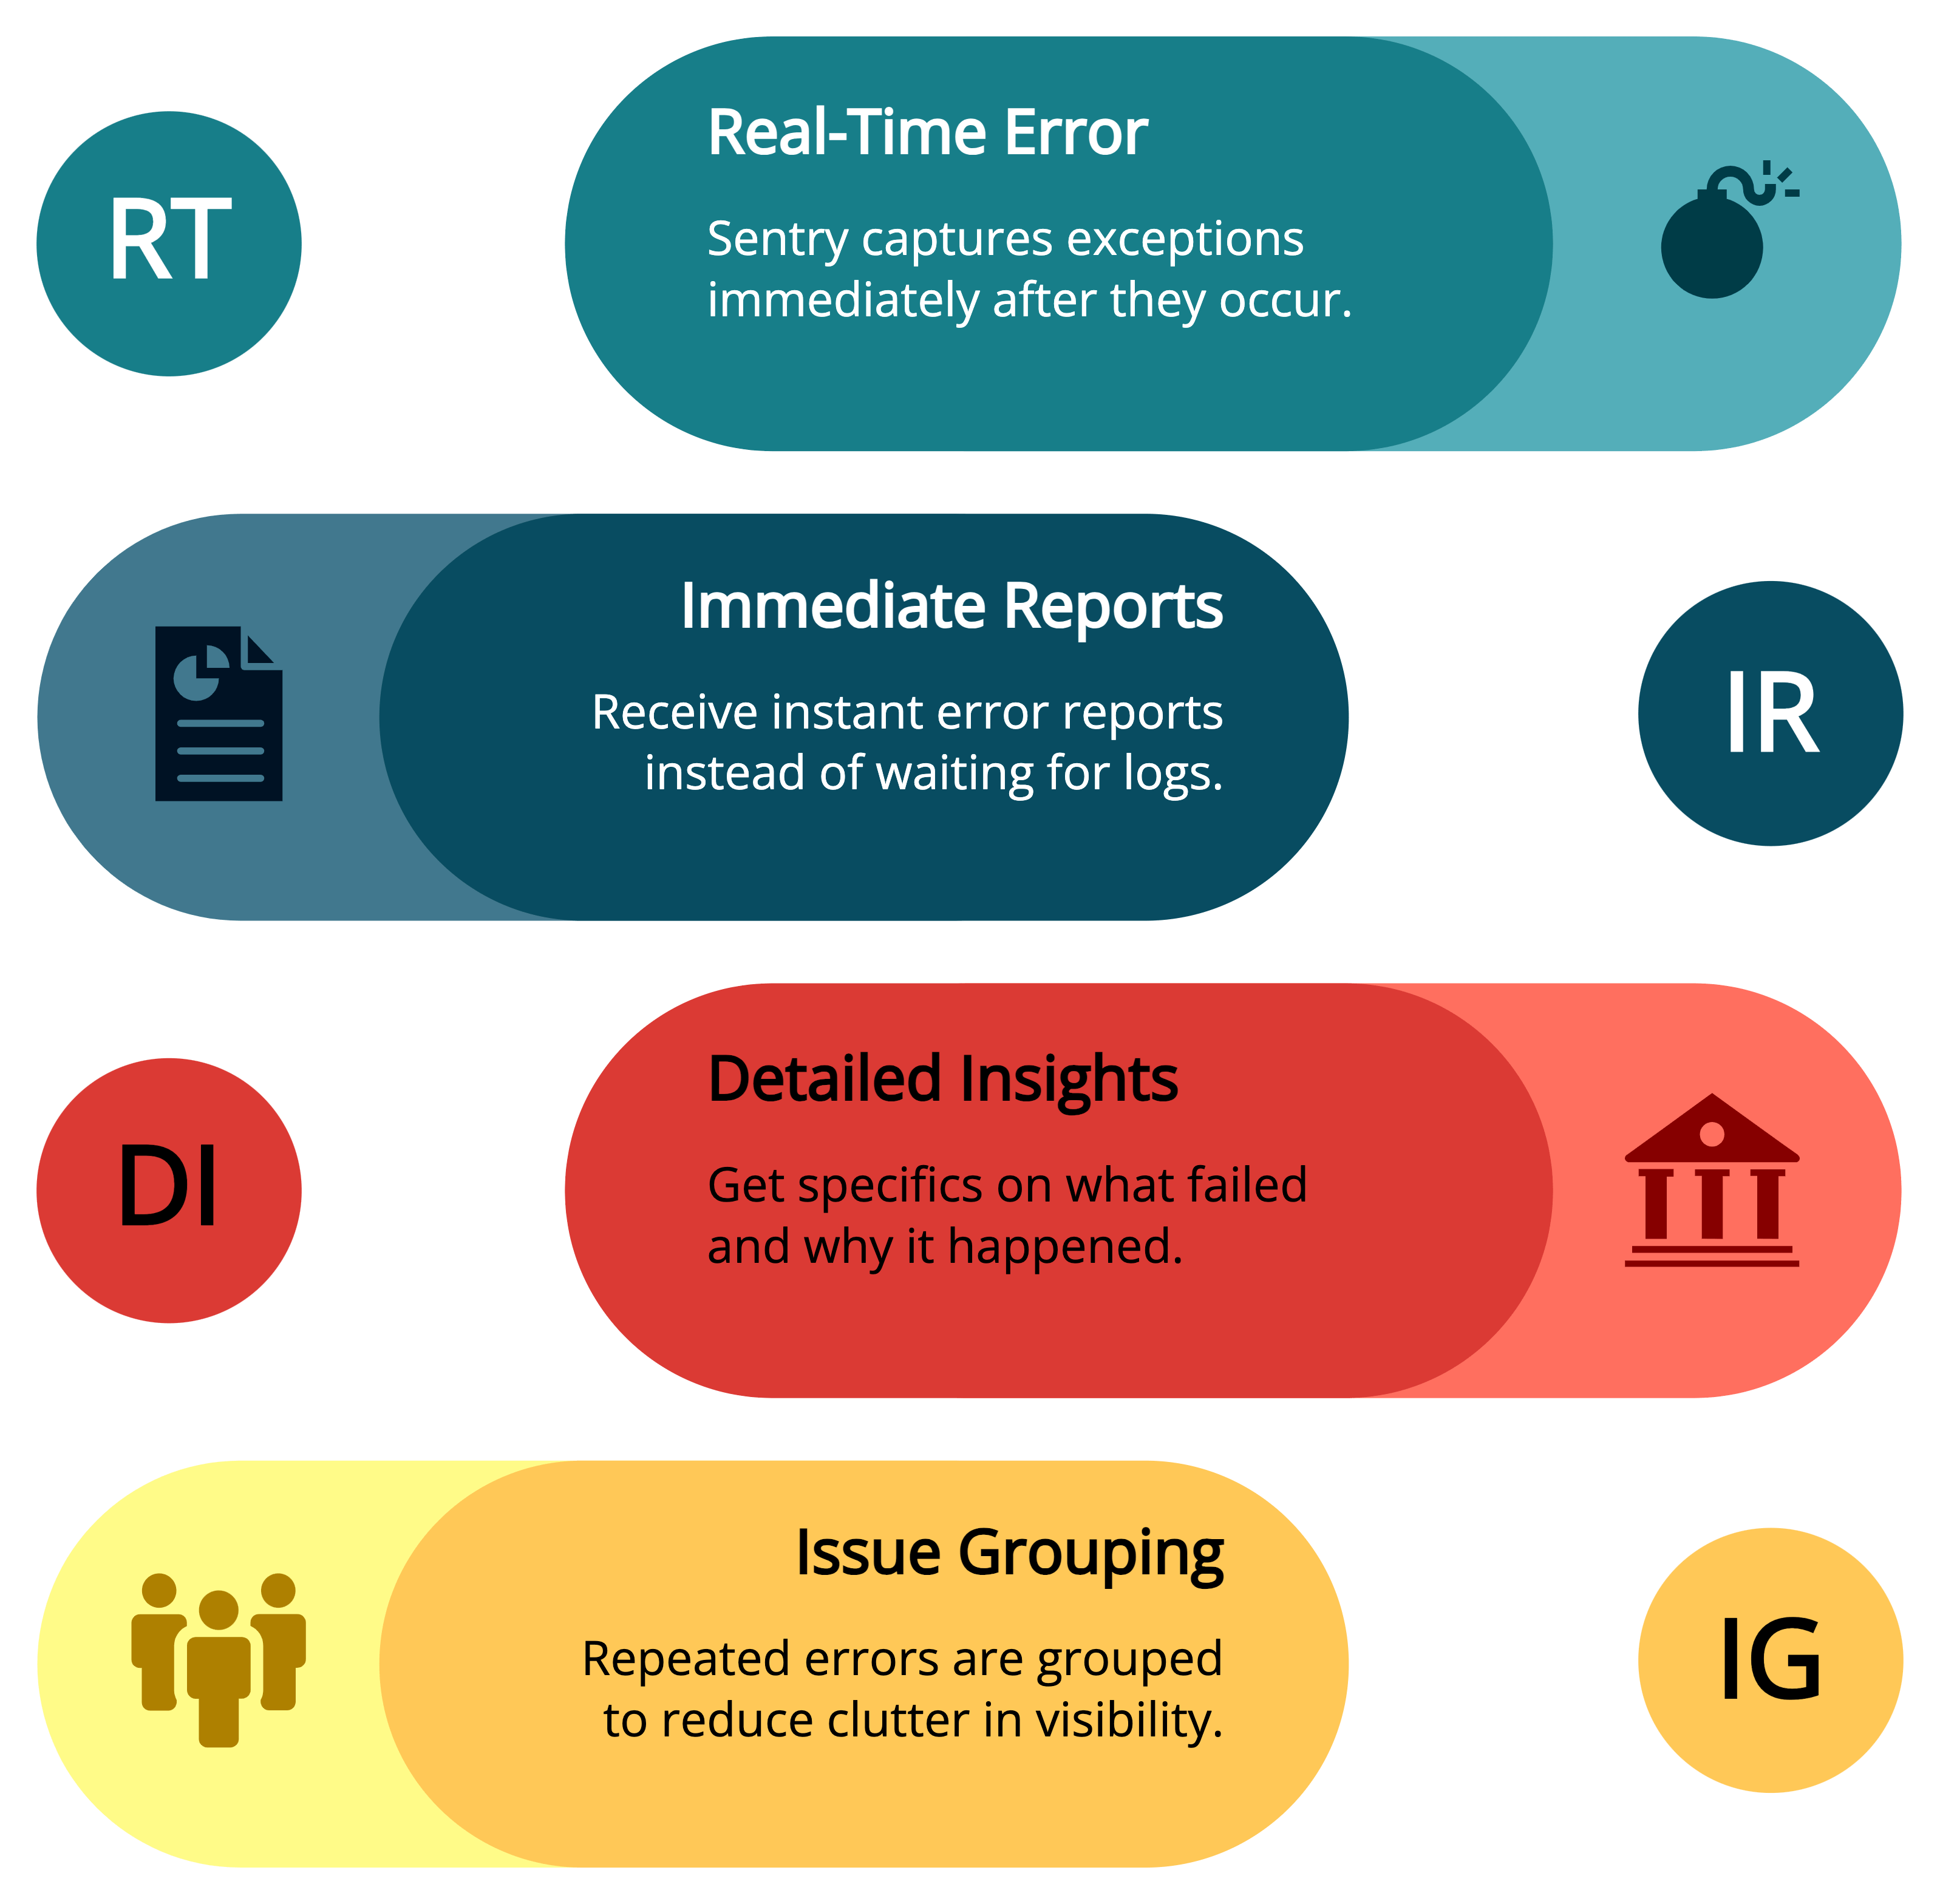
1. Real-Time Error Detection
Sentry captures exceptions as soon as they happen. This means you don’t have to wait for logs to process or go digging through CloudWatch.
What you get:
Immediate error reports
Details about what failed and why
Grouped issues so repeated errors don’t clutter your dashboard
Code Example:
Best Practices for Monitoring AWS Lambda with Sentry
1. Set an Appropriate Sampling Rate
For high-traffic applications, avoid logging every request. Use traces_sample_rate=0.1 to log only 10% of requests.
2. Use Environment Tags for Better Organization
Tag logs with environment details to differentiate between staging and production:
sentry_sdk.set_tag(“environment”, “production”)
3. Capture Custom Context Data
Add request-specific details for better debugging:
sentry_sdk.set_context(“request”, {“user_id”: “12345”, “route”: “/api/test”})
4. Monitor Memory and Execution Time
Use AWS CloudWatch along with Sentry to track function duration and memory usage.
5. Handle Sensitive Data Carefully
Avoid sending sensitive data to Sentry. Mask personal information before logging.

Lydia is a seasoned technical author, well-versed in the intricacies of software development and a dedicated practitioner of Python. With a career spanning 16 years, Lydia has made significant contributions as a programmer and scrum master at renowned companies such as Thompsons, Deloit, and The GAP, where they have been instrumental in delivering successful projects.
A proud alumnus of Duke University, Lydia pursued a degree in Computer Science, solidifying their academic foundation. At Duke, they gained a comprehensive understanding of computer systems, algorithms, and programming languages, which paved the way for their career in the ever-evolving field of software development.
As a technical author, Lydia remains committed to fostering knowledge sharing and promoting the growth of the computer science community. Their dedication to Python development, coupled with their expertise as a programmer and scrum master, positions them as a trusted source of guidance and insight. Through their publications and engagements, Lydia continues to inspire and empower fellow technologists, leaving an indelible mark on the world of scientific computer science.
